
The Predictive Power of Dillo Day
A dive into the predictive power of Northwestern’s largest music festival – Dillo Day. I used Google Trends search data to analyze artists career paths before and after performing at Dillo Day. The article was published in The North by Northwestern Magazine.

Go U Northwestern, I Forget This Line
A visual analysis of Northwestern’s fight song, broken down by year (Freshman, Sophomore, etc…). I got nearly 100 participants to recite the fight song for me and evaluated their correctness on a word-by-word basis to arrive at this graph. The article was published in the North by Northwestern Magazine.
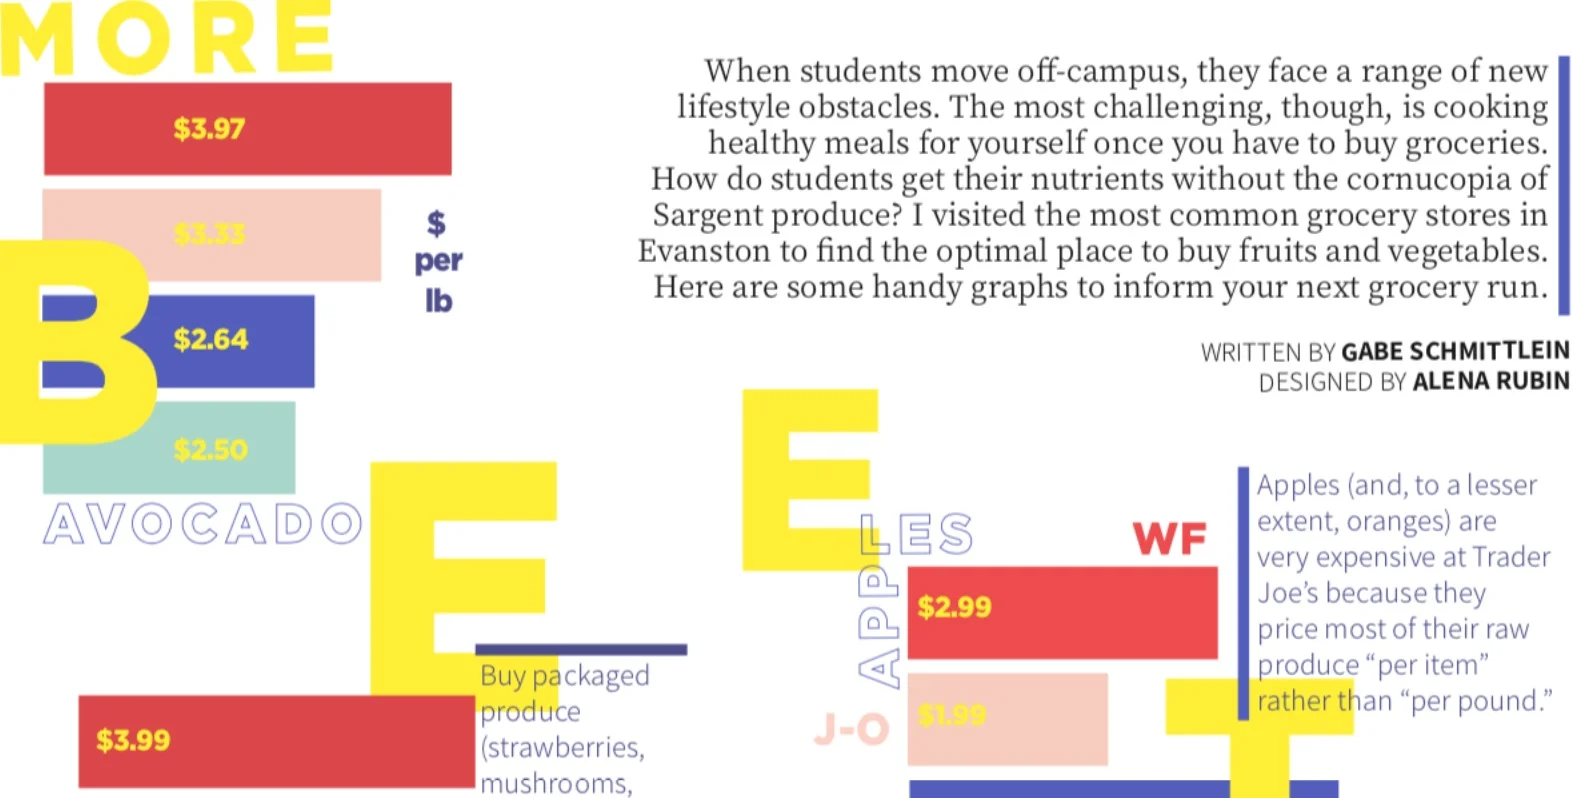
More Beets for Your Buck
I researched and wrote this data-driven dive into the Evanston produce aisles. The article was published in the North by Northwestern Magazine, and the online, interactive version (soon to be finished) was built using D3, a JavaScript data visualization library, as well as basic HTML and CSS.

Analyzing NBA Player Performance by Home State
As a final project for my Statistics 302 – Data Visualization class, I created this interactive app, allowing users to explore NBA player performance by home state. The app was created using R and Shiny, an interactive graphics package.